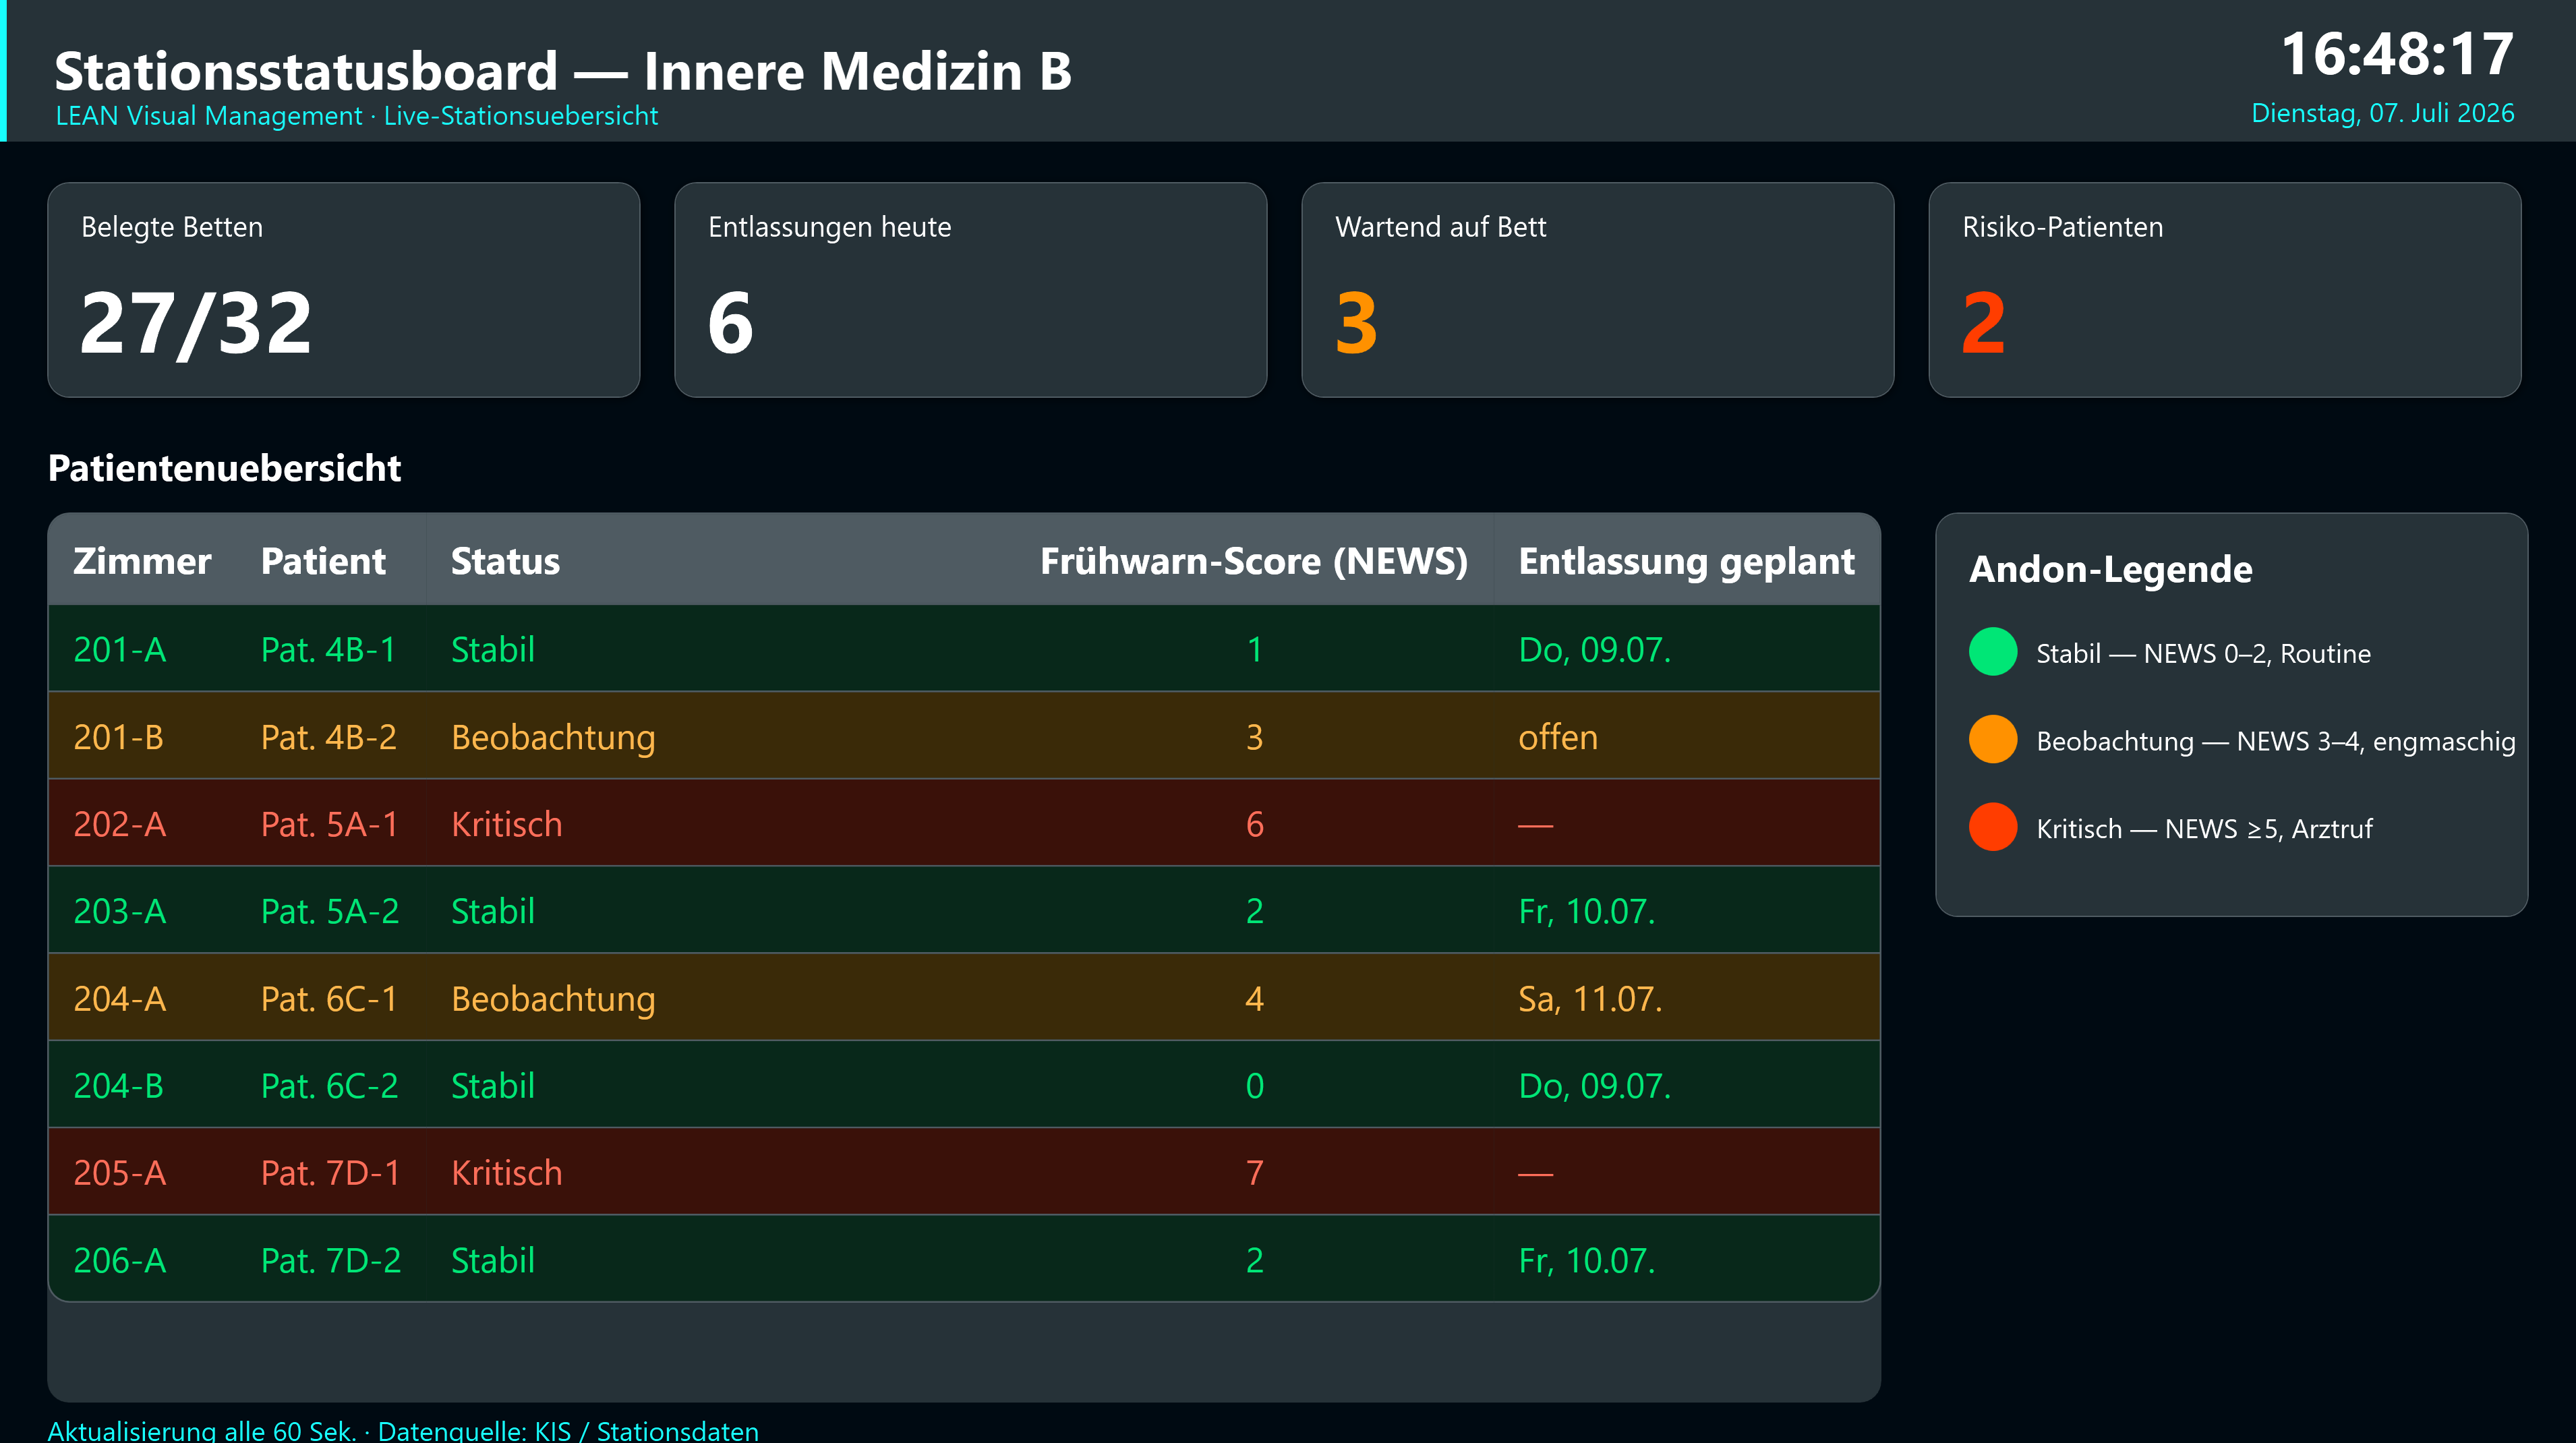
At 08:30 a charge nurse, a physician, and a pharmacist stand in front of a board on the ward wall. It takes them less than ten minutes: which patients are at risk of deteriorating, which beds are blocked, which discharge is waiting on a single lab result. Nobody logs into a system. The information is on the wall, in front of everyone, because the whole point of the board is that you cannot not see it. This is visual management - one of the quietest imports from the factory floor, and one of the best evidenced.
What visual management actually is
In the Toyota Production System, the ideal is a workplace where the status of the work is obvious at a glance - so that any deviation from normal announces itself and can be acted on immediately. The most famous instance is the andon: a signal that flags an abnormality in a process. As the Virginia Mason Institute puts it, an andon is “a tool that signals a person or a team that there’s an abnormality or defect in a process” - and, crucially, “the most important aspect of an andon is not the light, the sound or the tool - it’s the response to the andon.”
Healthcare has its own andon. When Virginia Mason Medical Center adopted the Toyota Production System in 2002, it built the Patient Safety Alert system, which lets any staff member stop the line when they see a situation that could harm a patient. The measured effect on surfacing problems was dramatic: reports rose from an average of 3 per month in 2002 to 285 per month in 2006, and by December 2006 the system had received 6,112 reports - 44% from nurses, 23% from non-clinical support staff, 20% from managers, and 8% from physicians. Most were processed within 24 hours (Furman & Caplan, Joint Commission Journal on Quality and Patient Safety, 2007). Making the problem visible was the precondition for fixing it.
The evidence that visibility changes outcomes
Visual management in a hospital most often takes the form of the daily huddle in front of a status board. The Institute for Healthcare Improvement defines a huddle plainly: “a short, stand-up meeting - 10 minutes or less” used to look ahead and manage safety proactively.
The strongest outcome data come from Cincinnati Children’s Hospital. A team built a situation-awareness system - tiered huddles feeding a shared, visible picture of which patients were at risk - and measured what happened. The rate of “unsafe transfers” (children moved to intensive care with unrecognized deterioration) fell from 4.4 to 2.4 per 10,000 non-ICU patient-days, roughly a 45% reduction, while the interval between serious safety events lengthened substantially (Brady et al., Pediatrics, 2013). A companion qualitative study explained why it worked: the huddles built information sharing, accountability, and a collective, real-time awareness of risk that no individual held alone (Goldenhar et al., BMJ Quality & Safety, 2013).
The broader literature is encouraging but more measured. A 2024 systematic review of visualising healthcare quality performance included 12 studies (2 randomized, 10 observational); 10 reported a statistically significant improvement in at least one outcome, and the authors concluded that “performance visualisation tools have the potential to improve clinical performance indicators” - while noting that study quality and design varied (Yang et al., BMJ Open, 2024). The honest reading: visualisation reliably helps, but it is not automatic, and the evidence base is still maturing.
From the whiteboard to the real-time screen
Classic visual management runs on marker and magnets - and the magnetic whiteboard still works. Its limit is that a human has to keep it current. The moment the data lives in a system - beds in the ADT, results in the LIS, cases in the OR schedule, staffing in the roster - a hand-updated board drifts out of date, and a board people have learned to distrust is worse than no board at all.
This is the gap that digital status boards close: a wall-mounted screen that reads the source systems and refreshes itself. It is the same technology story playing out in manufacturing, where operational data has long been pulled onto shop-floor displays. Peakboard is one example of the tooling behind such screens - a no-code platform (Peakboard Designer, plus an on-site Peakboard Box) built to turn live data from systems like SAP, OPC UA, MQTT or plain Excel into always-on operational displays. Founded in Stuttgart in 2016, its documented deployments are industrial rather than clinical; applying that same visual-management logic to a ward or an OR board is an extension of the idea, not a claim of published hospital outcomes. The technology makes a live board practical; whether it improves care depends on everything around it.
The limit worth stating plainly
Which returns us to the andon principle: the light is not the point, the response is. A board that no one huddles around is decoration. A real-time screen that surfaces a deteriorating patient but triggers no agreed action is a more expensive decoration. Every result above - Virginia Mason’s alerts, Cincinnati’s huddles - came from pairing the visible signal with a disciplined human response: someone empowered to stop the line, a team that meets every morning, a standard for what happens when a metric turns red.
The takeaway
Visual management works because it changes what a team can see together, at a glance, in time to act. The board - whiteboard or screen - is only the surface. Buy the display and skip the daily huddle and the standard response, and you have bought a monitor. Build the response first and let the board serve it, and you have built the thing the factory floor discovered decades ago: work you can no longer look away from.
Sources
- Furman C, Caplan R. “Applying the Toyota Production System: using a patient safety alert system to reduce error.” Joint Commission Journal on Quality and Patient Safety, 2007;33(7):376-86. https://pubmed.ncbi.nlm.nih.gov/17711139/
- Brady PW, Muething S, Kotagal U, et al. “Improving Situation Awareness to Reduce Unrecognized Clinical Deterioration and Serious Safety Events.” Pediatrics, 2013;131(1):e298-e308. https://pmc.ncbi.nlm.nih.gov/articles/PMC4528338/
- Goldenhar LM, Brady PW, Sutcliffe KM, Muething SE. “Huddling for high reliability and situation awareness.” BMJ Quality & Safety, 2013;22(11):899-906. https://pubmed.ncbi.nlm.nih.gov/23744537/
- Yang Z, Alveyn E, Dey M, et al. “Impact of visualising healthcare quality performance: a systematic review.” BMJ Open, 2024;14(11):e083620. https://pubmed.ncbi.nlm.nih.gov/39488428/
- Institute for Healthcare Improvement. “Patient Safety Essentials Toolkit: Huddles.” https://www.ihi.org/sites/default/files/SafetyToolkit_Huddles.pdf
- Virginia Mason Institute. “How can andons improve patient safety?” https://www.virginiamasoninstitute.org/blog/how-can-andons-improve-patient-safety
- Peakboard GmbH. “About us / Company.” https://peakboard.com/en-us/company/about-us/