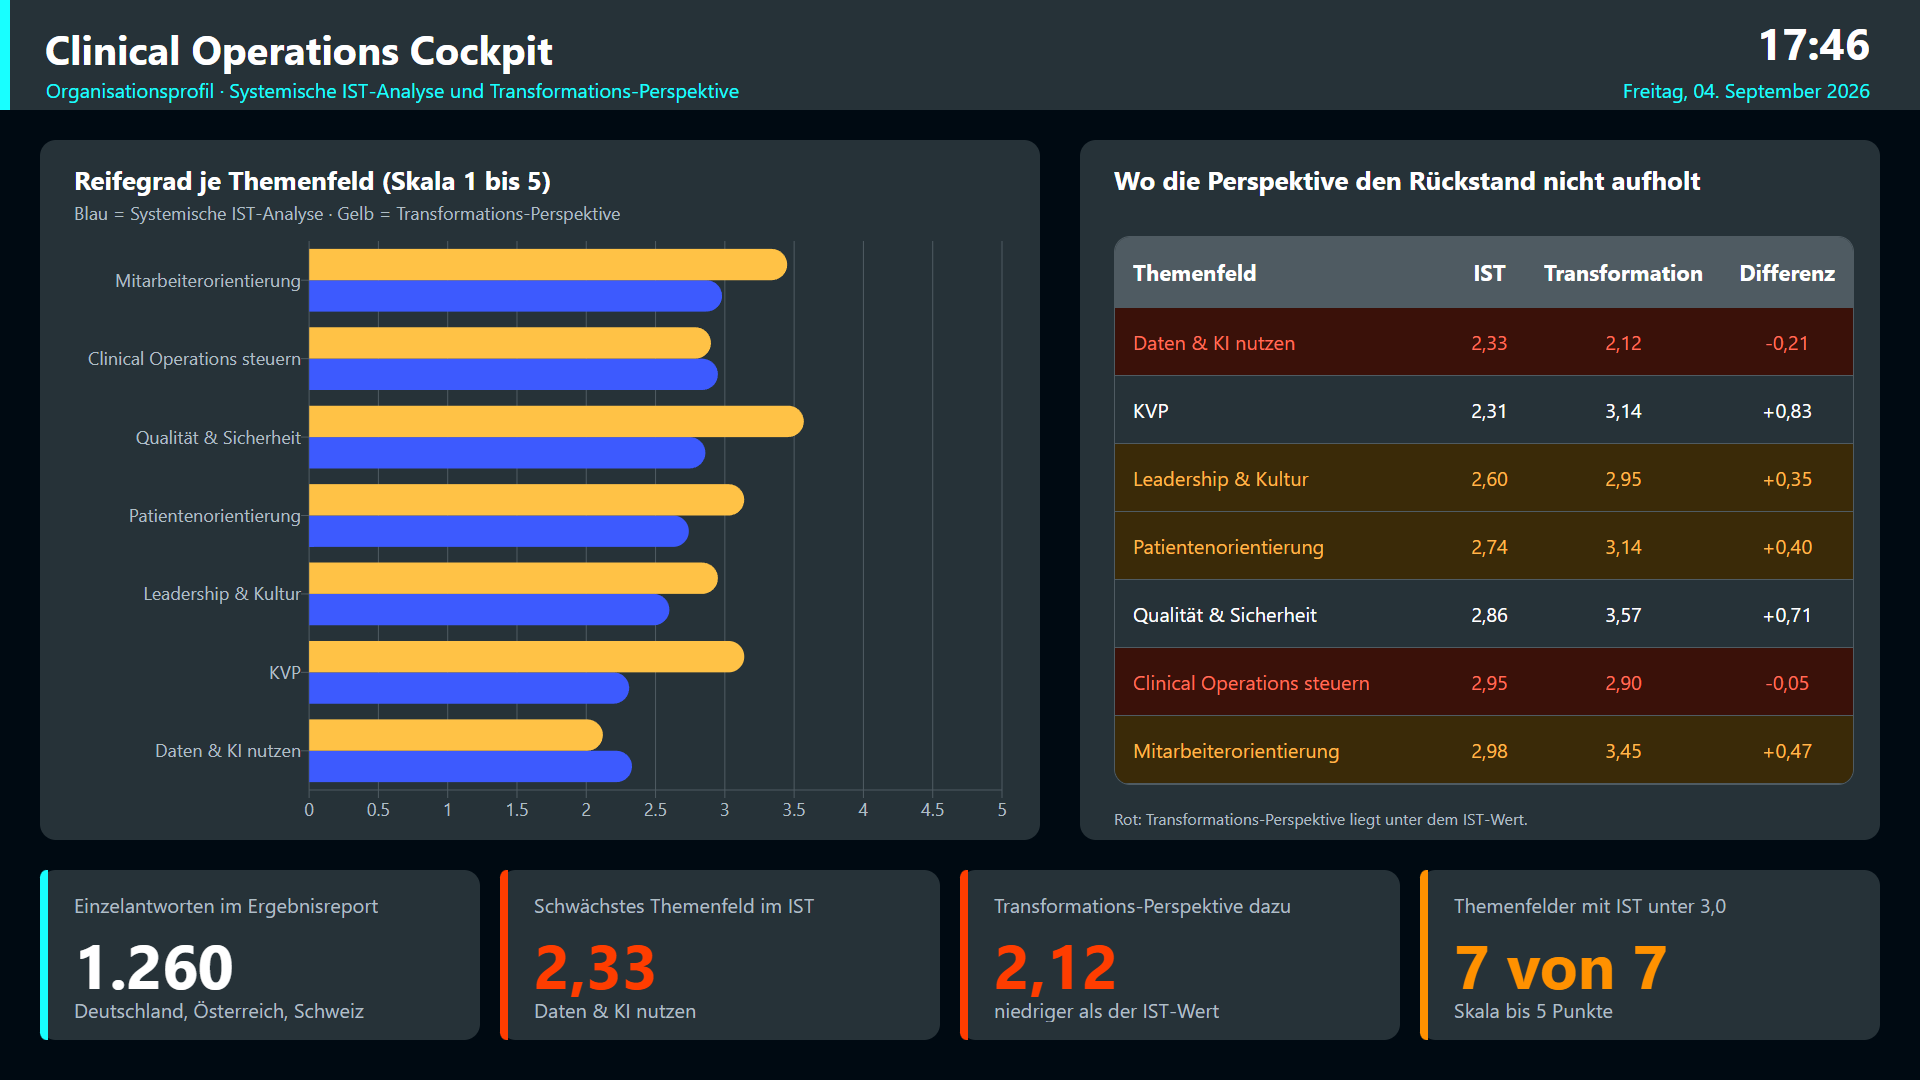
In short: Clinical operations in hospitals means running the care process across departmental boundaries — patient flow, capacity, bottlenecks and the coordination between emergency department, ward, operating theatre and diagnostics. The first Clinical Operations results report evaluates 1,260 individual responses from Germany, Austria and Switzerland and scores every one of the seven fields below 3.0 out of 5 points. The lowest is “using data and AI” at 2.33 points, and the transformation perspective for that same field falls further, to 2.12 points. A board that pulls the numbers a hospital already has out of its clinical information system, spreadsheets and theatre schedule takes an afternoon to build.
Monday, 11:20. In the emergency department the waiting time has been above target for an hour, ward 4B has two free beds, the theatre has lost an hour of table time, and radiology is holding seven CT requests. Each of those four numbers exists in some system. None of them share a screen, and nobody has seen them next to each other all morning.
What is clinical operations in a hospital?
Clinical operations in a hospital is the operational management of the care process across departmental boundaries. Patient flow, bed capacity, theatre utilisation, diagnostic turnaround times and discharge are steered as one connected system. The goal is a working day in which a bottleneck becomes visible early and a named person responds within the shift.
What does the first maturity report say?
It says that not a single field reaches the middle of the scale today. The first Clinical Operations results report by Ralf Volkmer, published on 29 August 2026, evaluates complete organisational profiles from Germany, Austria and Switzerland with 1,260 individual responses in total. Scoring runs from 1 to 5 points, with 5 as the highest possible value.
The survey measures each field twice. The systemic current-state analysis shows how strongly a field is developed today. The transformation perspective shows how respondents rate the conditions for developing it further.
| Field | Current state | Transformation perspective | Difference |
|---|---|---|---|
| Using data and AI | 2.33 | 2.12 | −0.21 |
| Continuous improvement | 2.31 | 3.14 | +0.83 |
| Leadership and culture | 2.60 | 2.95 | +0.35 |
| Patient orientation | 2.74 | 3.14 | +0.40 |
| Quality and safety | 2.86 | 3.57 | +0.71 |
| Steering clinical operations | 2.95 | 2.90 | −0.05 |
| Staff orientation | 2.98 | 3.45 | +0.47 |
All seven current-state scores sit below 3.0 points. Even the highest transformation perspective, 3.57 points for quality and safety, stays well short of the maximum of 5.
Why is the transformation perspective the real finding?
Because it measures whether an organisation believes it can fix a deficit it already knows about. A low current-state score describes a gap. A low transformation perspective describes missing confidence in leadership, escalation paths, data access and cross-departmental collaboration.
In two of the seven fields the perspective falls below today’s state: “using data and AI” at 2.12 against 2.33 points, and “steering clinical operations” at 2.90 against 2.95 points. Precisely the two fields that carry daily operational management are the ones respondents rate as least ready to develop.
A positive difference carries little further here. Leadership and culture moves from 2.60 to 2.95 points. The direction is right and the level stays below the midpoint of the scale.
Why is the data field the weakest of all?
Because the data exists and still fails to arrive. A hospital produces occupancy figures, waiting times, theatre times and diagnostic turnaround times every day. They sit in the clinical information system, the duty roster, the theatre schedule and a row of spreadsheets.
The effort goes into collecting them. Physicians and nurses spend on average a third of their daily working time on documentation tasks, close to three hours; that comes from a survey of 400 hospitals by the Deutsches Krankenhausinstitut in September 2025. That time flows into reports that are accurate in hindsight and arrive too late for the decision at 11:20.
This explains the link between the two weakest fields. A hospital that sees its figures at month end is steering its hospital reporting obligations rather than its operation.
What does clinical operations look like on a board?
Like a screen showing the day as it runs. The four elements the report groups under “steering clinical operations” — patient flow, capacity, bottlenecks, cross-departmental coordination — fit onto one surface: key figures with their targets along the top, the open bottlenecks below with action, owner and status, and the arrival curve for the day beside them.
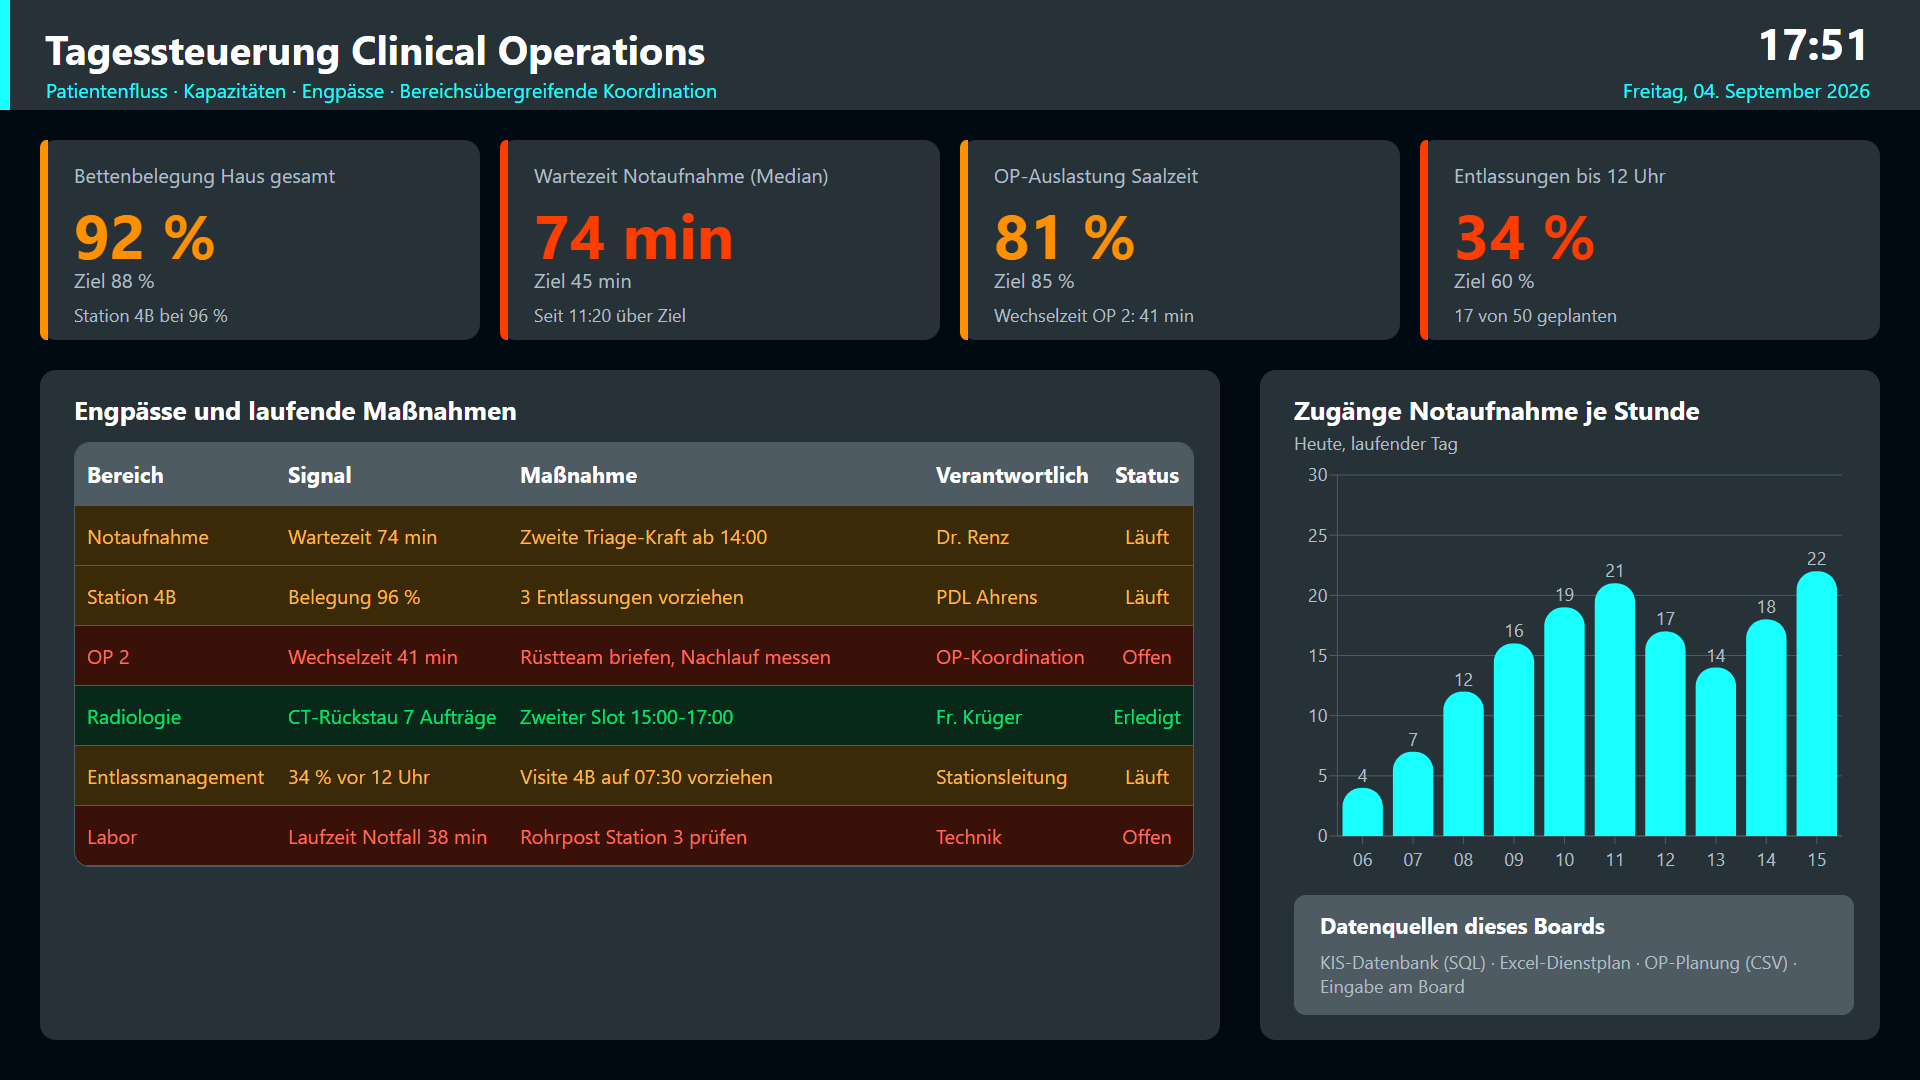
The colour change is the actual function. A row turns red while an action is open and green once it is done. In the morning huddle that removes the question of where to start.
The example is built with Peakboard. Peakboard is a low-code platform for real-time dashboards from industry (manufacturing and logistics), whose boards work just as well for wards, emergency departments and operating-theatre areas. The kinship is substantive: a factory control screen shows throughput time, utilisation and disruption; a hospital control screen shows length of stay, occupancy and bottleneck.
Which key figures belong on a clinical operations board?
Four to six, each with a target and a named owner. More tiles produce a picture nobody reads any more.
- Bed occupancy per ward, against the hospital’s target.
- Emergency department waiting time, as the median for the running shift. It signals overload earlier than case numbers do.
- Theatre utilisation of table time, together with turnover time per theatre.
- Share of discharges before noon. This figure decides whether beds are available in the afternoon.
- Open bottlenecks with action and status, visible to every department involved.
The first four are patient-flow figures. The fifth is the link to action and the reason a board is more than a display. How that visibility works in the daily routine is described in the article on visual management in hospitals.
How quickly does a board like this come together?
In an afternoon, provided the numbers already sit in a database, a spreadsheet or a CSV export. The board in this article has two screen pages: the organisational profile from the results report and the daily control view. It was assembled from standard elements — key-figure tiles, a table with coloured rows and two charts.
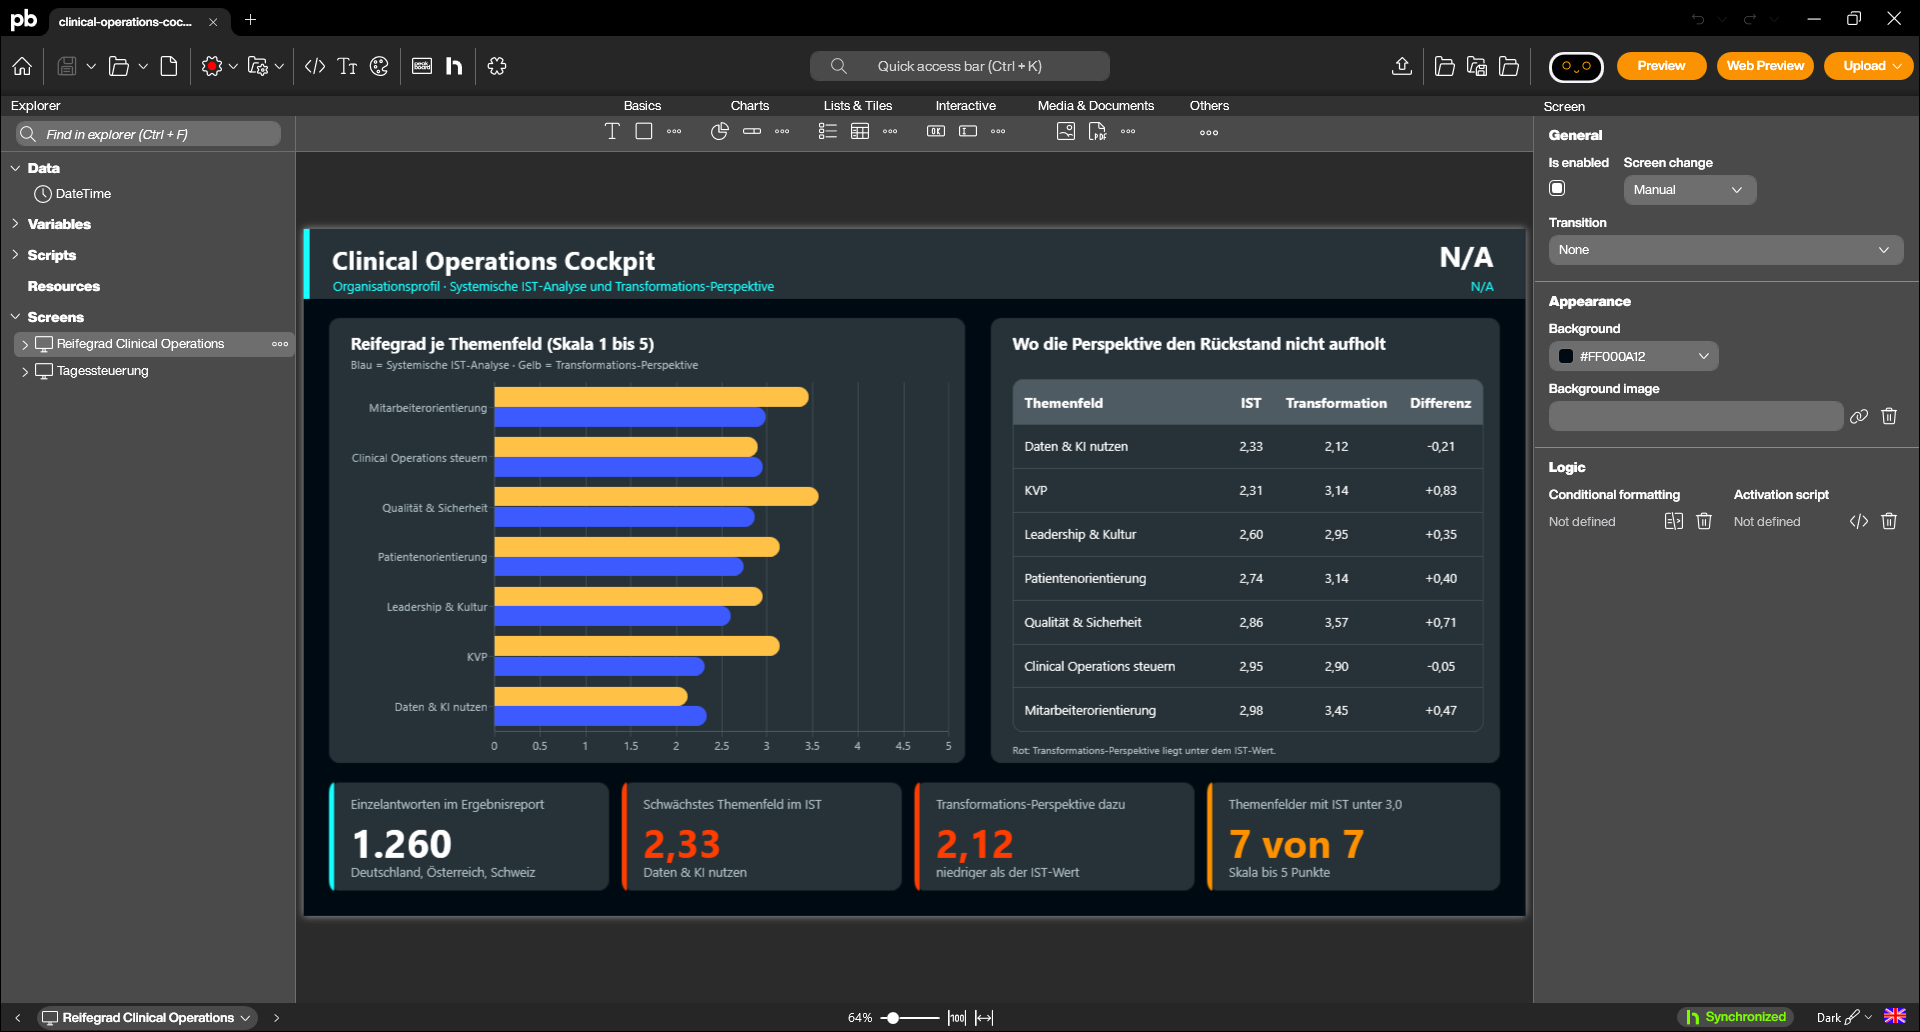
Trying this out takes no IT project: the Peakboard Designer is free, and the board from this article is available here on the blog. Download clinical-operations-cockpit.pbmx, open it in the Designer and swap the key figures for your own. The daily-control values are invented sample data; the maturity scores come from the results report.
What a board does not solve
It does not replace agreement on what a figure means. “Occupancy” means staffed beds, operable beds or occupied beds depending on the hospital, and a screen spreads that ambiguity reliably across every ward at once.
Nor does it replace the routine. A board without a fixed daily huddle becomes decoration within three weeks. The report itself points the same way: under “steering clinical operations” the shortage is less about tools than about leadership, learning routines and cross-departmental collaboration.
It also states a limit to its own evidence: 1,260 individual responses are not a representative picture of the sector.
What hospitals can take from this
The report asks an uncomfortable question: what happens when an organisation knows its weaknesses and does not believe it can overcome them? For boards and executive management that is a leadership question rather than a task for a project team.
The smallest solid step still lies in the weakest field. Visibility can be created in days while cultural work takes years — and a team that sees its four most important numbers together every morning collects exactly the experience that confidence grows from. A field scoring 2.12 points on the transformation perspective is therefore also the field with the shortest route to a first result. The rest is the daily repetition that turns a screen into a management routine — the Lean Hospital overview places the methods in context.
Frequently asked questions about clinical operations in hospitals
What does clinical operations mean in a hospital?
Clinical operations means running the care process across departmental boundaries. It covers patient flow, bed capacity, operating-theatre utilisation, diagnostic turnaround times and discharge as one connected system. The term comes from the Clinical Operations Framework, which ties strategy, leadership, processes, data and continuous improvement into a single management approach.
How many hospitals stand behind the Clinical Operations maturity report?
The first results report evaluates 1,260 individual responses from complete organisational profiles in Germany, Austria and Switzerland, published by Ralf Volkmer on 29 August 2026 on LeanBase. The author himself states that the sample is not yet representative of the sector.
What is the difference between the current-state analysis and the transformation perspective?
The systemic current-state analysis measures how strongly a field is developed today. The transformation perspective measures how respondents rate the conditions for developing that field further. Both run on a scale from 1 to 5 points. When the perspective falls below the current-state score, the organisation lacks confidence in its own capacity to change.
How long does it take to build a board for daily operational control?
A first board with four key figures, a bottleneck list and a trend curve takes an afternoon, provided the numbers already sit in a database, a spreadsheet or a CSV export. The effort then shifts from the technology to agreeing what each figure means and who acts when it turns red.
Sources
- Volkmer, Ralf. “Krankenhäuser erkennen ihre Schwächen – doch das Vertrauen in die eigene Veränderungsfähigkeit bleibt begrenzt.” LeanBase, 29 August 2026. https://leanbase.de/publishing/post/mvpkg-krankenhauser-erkennen-ihre-schwachen-doch-d
- Volkmer, Ralf. “Das Methodenparadox der Krankenhäuser: Warum immer mehr Managementinstrumente und Methoden nicht automatisch zu besseren Krankenhäusern führen.” LeanBase, 24 August 2026. https://leanbase.de/publishing/post/2rs32-das-methodenparadox-der-krankenhauser-warum
- Deutsches Krankenhausinstitut. “DKI Blitzumfrage: Aktuelle Bürokratiebelastung in den Krankenhäusern 2025.” Survey of 400 hospitals, September 2025. https://www.dki.de/forschungsprojekt/dki-blitzumfrage-aktuelle-burokratiebelastung-in-den-krankenhausern-2025
- Deutsche Krankenhausgesellschaft. “Klinik-Verband legt Vorschläge zur Entbürokratisierung vor.” Press release, 11 December 2025. https://www.dkgev.de/dkg/presse/details/klinik-verband-legt-vorschlaege-zur-entbuerokratisierung-vor/