In short: Silo thinking in hospitals arises where every area meets its own target and the handover between areas belongs to nobody. Ralf Volkmer described this pattern on 24 August 2026 as the method paradox: hospitals invest in quality management, lean hospital work and digitalisation at the same time, and the same waiting times remain. The average bed occupancy of German hospitals was 72.0 percent in 2024, while emergency departments wait for beds in the morning. Digital support works exactly at that point: it shows every area the same situation at the same time.
The Monday morning shortly after seven that Volkmer describes looks the same in almost every hospital. The emergency department backs up because no beds are free on the wards. Discharges wait for missing findings. The theatre list wobbles. Nursing management balances absences by hand. This article takes those four examples onto one shared screen.
What is silo thinking in hospitals?
Silo thinking in hospitals is a way of working in which medicine, nursing, diagnostics and administration pursue separate goals, metrics and improvement projects. Every area optimises its own section. Patient waiting time then arises at the handovers in between, for which no area carries responsibility on its own.
The distinction from blame matters. Silos exist for good reasons: expertise needs depth, responsibility needs borders, and an operating theatre follows a different logic than a geriatric ward. The problem begins where that border also applies to information.
Why do more management methods not produce better hospitals?
Because most methods work inside one area. A quality project in radiology improves radiology. A lean project on ward 4B improves ward 4B. The handover between them appears in no project brief.
Volkmer calls this pattern the method paradox of hospitals. His observation touches a sore point: hospitals rarely suffer from too few initiatives. They suffer because those initiatives sit side by side and the question of the shared management system stays unanswered.
That leads to an uncomfortable test question. Of all the projects a hospital currently runs, how many carry a metric measured across a department border? In most houses the answer is a small number.
What does Monday morning at seven really show?
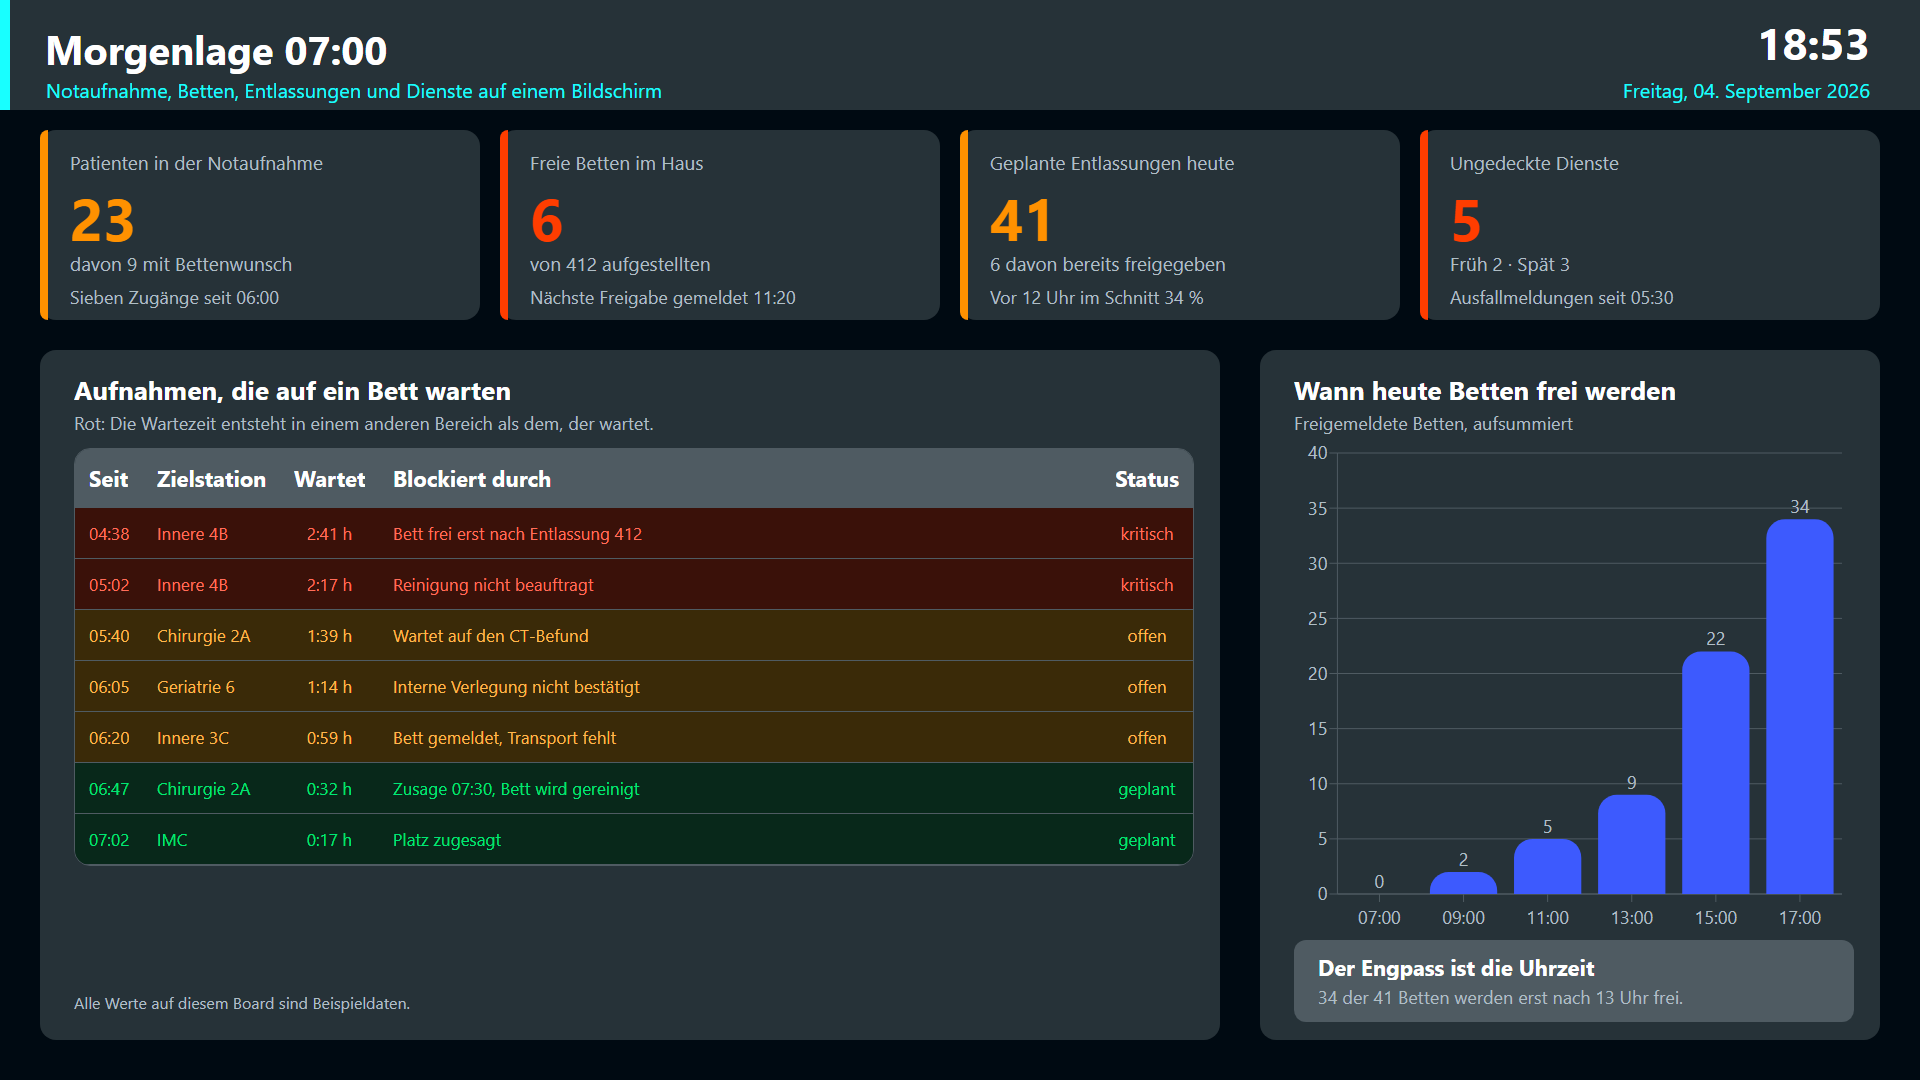
It shows four problems with one common cause. The picture above is the first screen of a board we built for this article. It puts Volkmer’s four examples side by side: 23 patients in the emergency department, six free beds, 41 planned discharges and five uncovered shifts.
The table below them is the interesting part. Seven admissions wait for a bed, and in no row does the reason sit in the emergency department itself. A bed becomes free only after a discharge, a cleaning job is unordered, a CT report is missing, an internal transfer is unconfirmed. The emergency department waits, and the causes sit in five other areas.
Every value on this board is invented example data. It shows the shape of such a view and describes the state of no real hospital.
Why does the emergency department wait while beds are free?
Because free beds and waiting admissions fall apart in time. The Federal Statistical Office reports an average bed occupancy of 72.0 percent for 2024, across 472,900 available beds in 1,841 hospitals. Arithmetically there is ample capacity, and on Monday morning at seven none of it is available.
The column chart on the first screen makes the effect visible: 34 of the 41 beds on the example day become free after 1 p.m. The bottleneck sits in the clock and in the reporting chain from the room to the admission desk.
That is why a shared view is more than a summary. It answers one question for everyone at the same time: which bed becomes free when, and what is holding it up?
What does a discharge actually hang on?
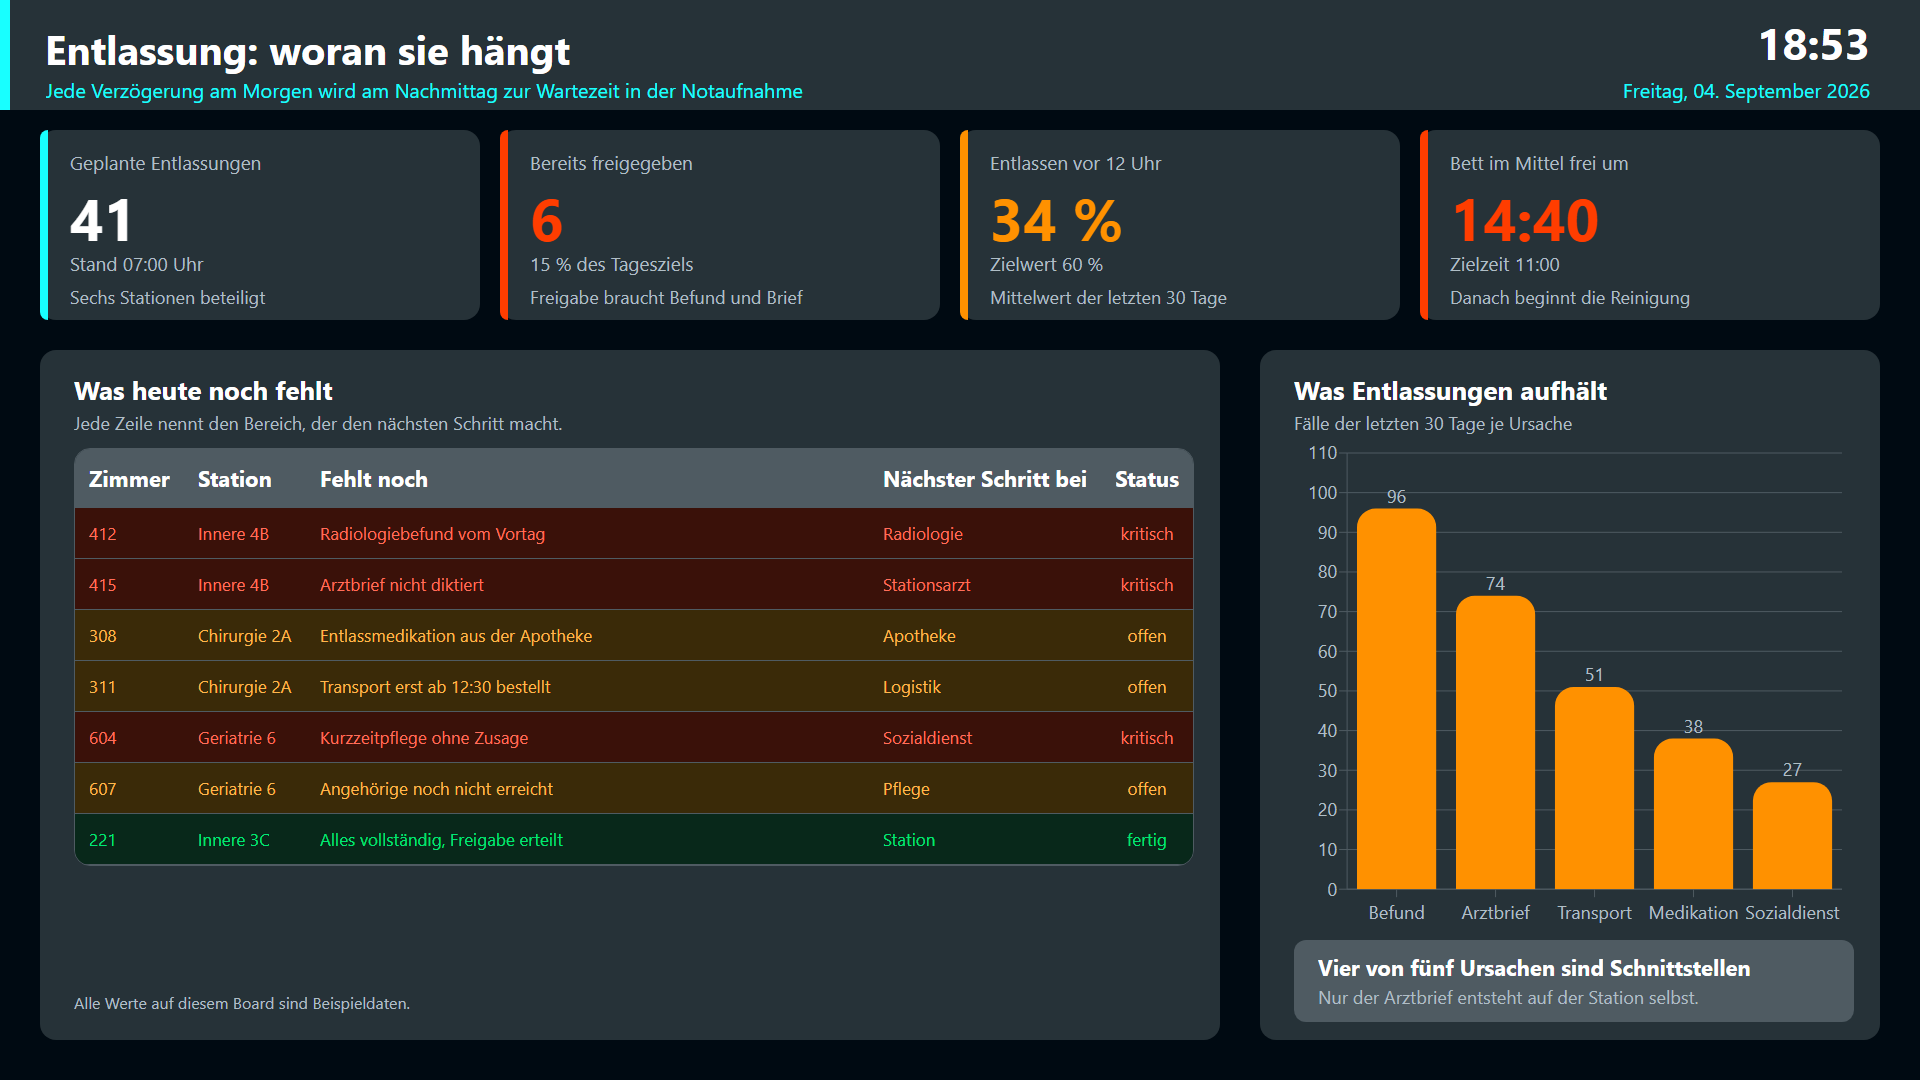
On one missing step, and it usually sits in another area. The second screen lists seven discharges of the example day with what is still missing: a radiology report from the previous day, an undictated discharge letter, medication from the pharmacy, a transport ordered too late, a confirmation from social services.
The chart beside it counts the causes of the last 30 days. Four of the five most frequent causes arise outside the ward that discharges. Only the discharge letter lies fully in its own hands.
That distribution explains why discharge management stalls as a ward project. The ward improves its own share and still depends on informal requests for the other four causes. A shared list turns those requests into a visible queue with a name and a time.
How does a shared board help the theatre list and staffing cover?
It puts two lists side by side that usually live in two departments. The third screen shows the first procedures of the day on the left with planned time, actual time and cause of deviation, and the staffing gaps of three shifts on the right with their cover status.
Two of the three largest delays in the example arose outside the theatre: a missing prior report and a patient who came late from ward 4B. Without that column the theatre meeting discusses turnaround times while the cause stays invisible.
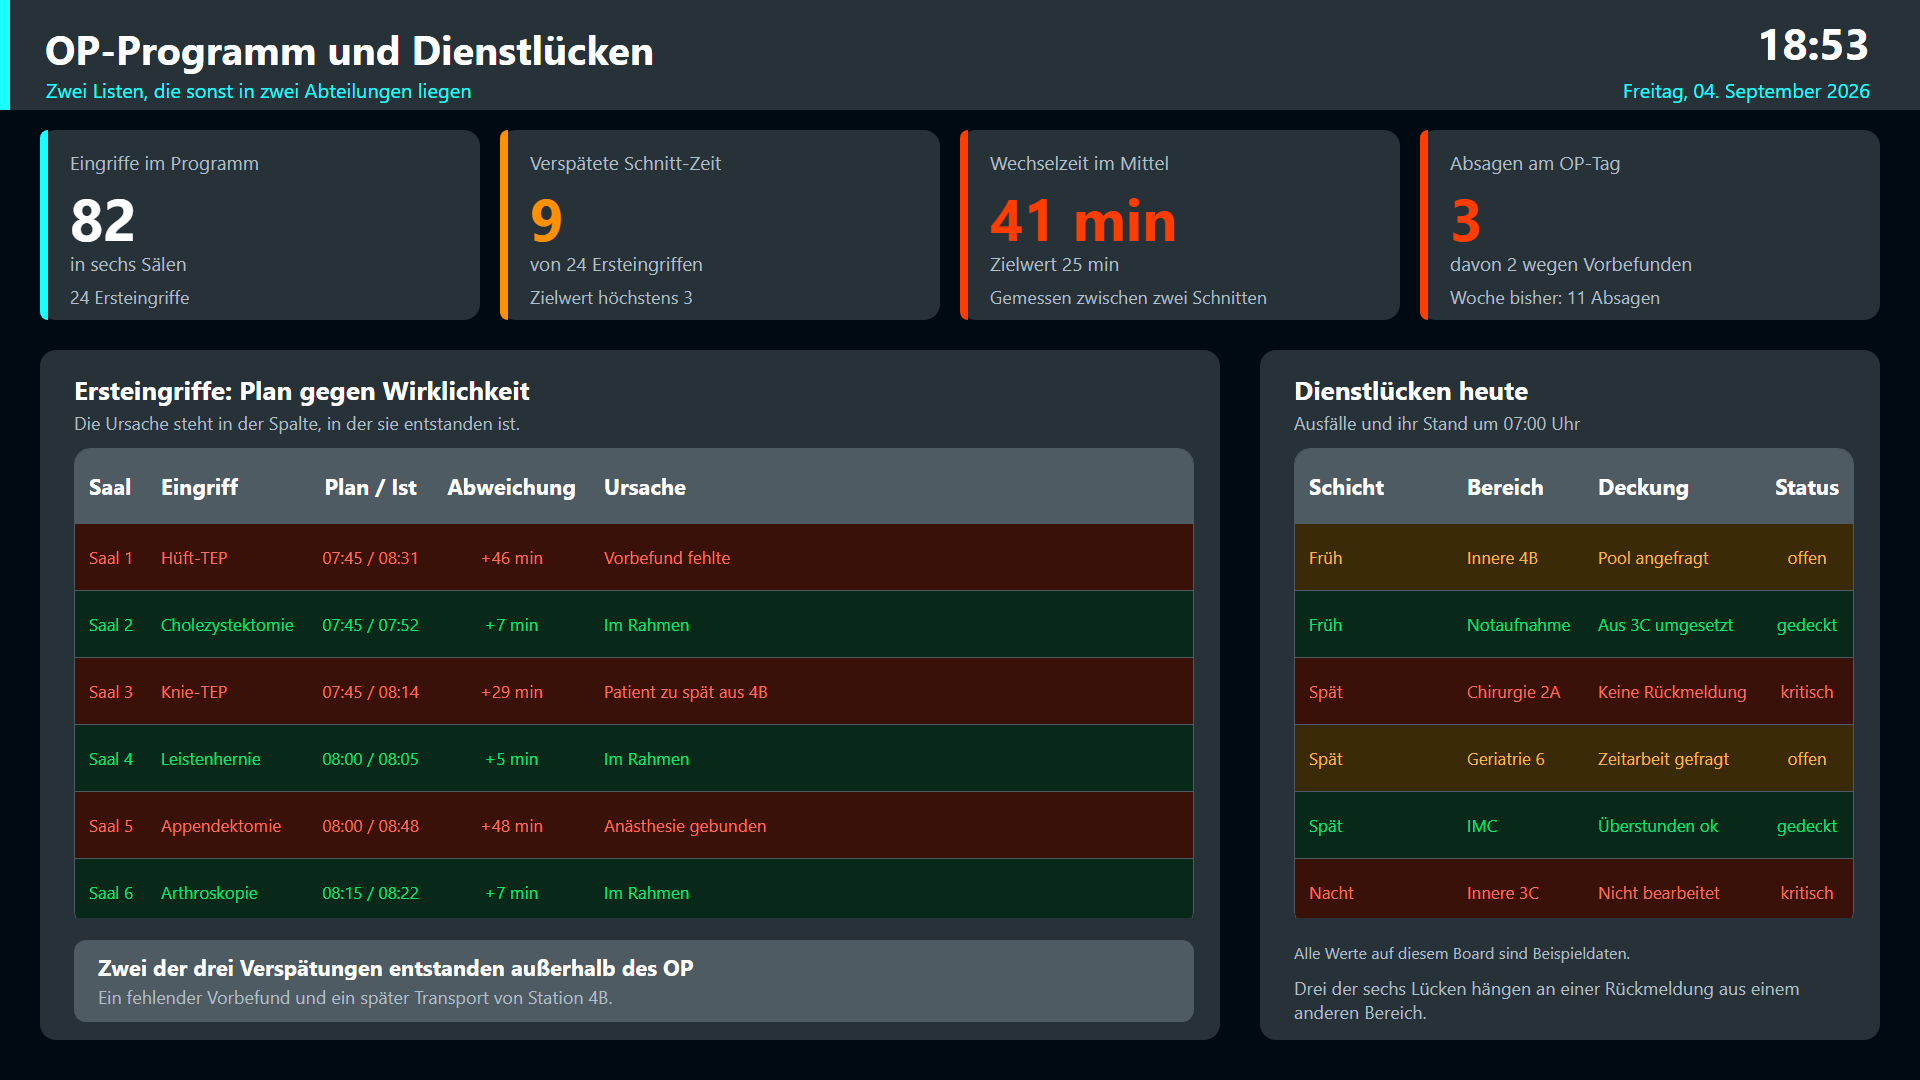
The same mechanism drives the staffing gaps. Three of the six gaps on the example day depend on a reply from another area. Made visible, that becomes a task of the morning round; left invisible, it stays the phone work of one manager.
Where does digitalisation help against the method paradox?
At four points that can be implemented within weeks. First, one shared situation for every area, so morning rounds talk about the same figures. Second, every waiting row linked to the area that takes the next step. Third, metrics across department borders, such as the time from the admission decision to the occupied bed. Fourth, a history that turns single cases into patterns.
The example in this article is built with Peakboard. Peakboard is a low-code platform for real-time dashboards from industry (manufacturing and logistics), whose boards work just as well for wards, emergency departments and operating theatres. The kinship is a matter of content: a production control board shows lead time, bottleneck and disruption, a hospital control board shows waiting time, handover and absence.
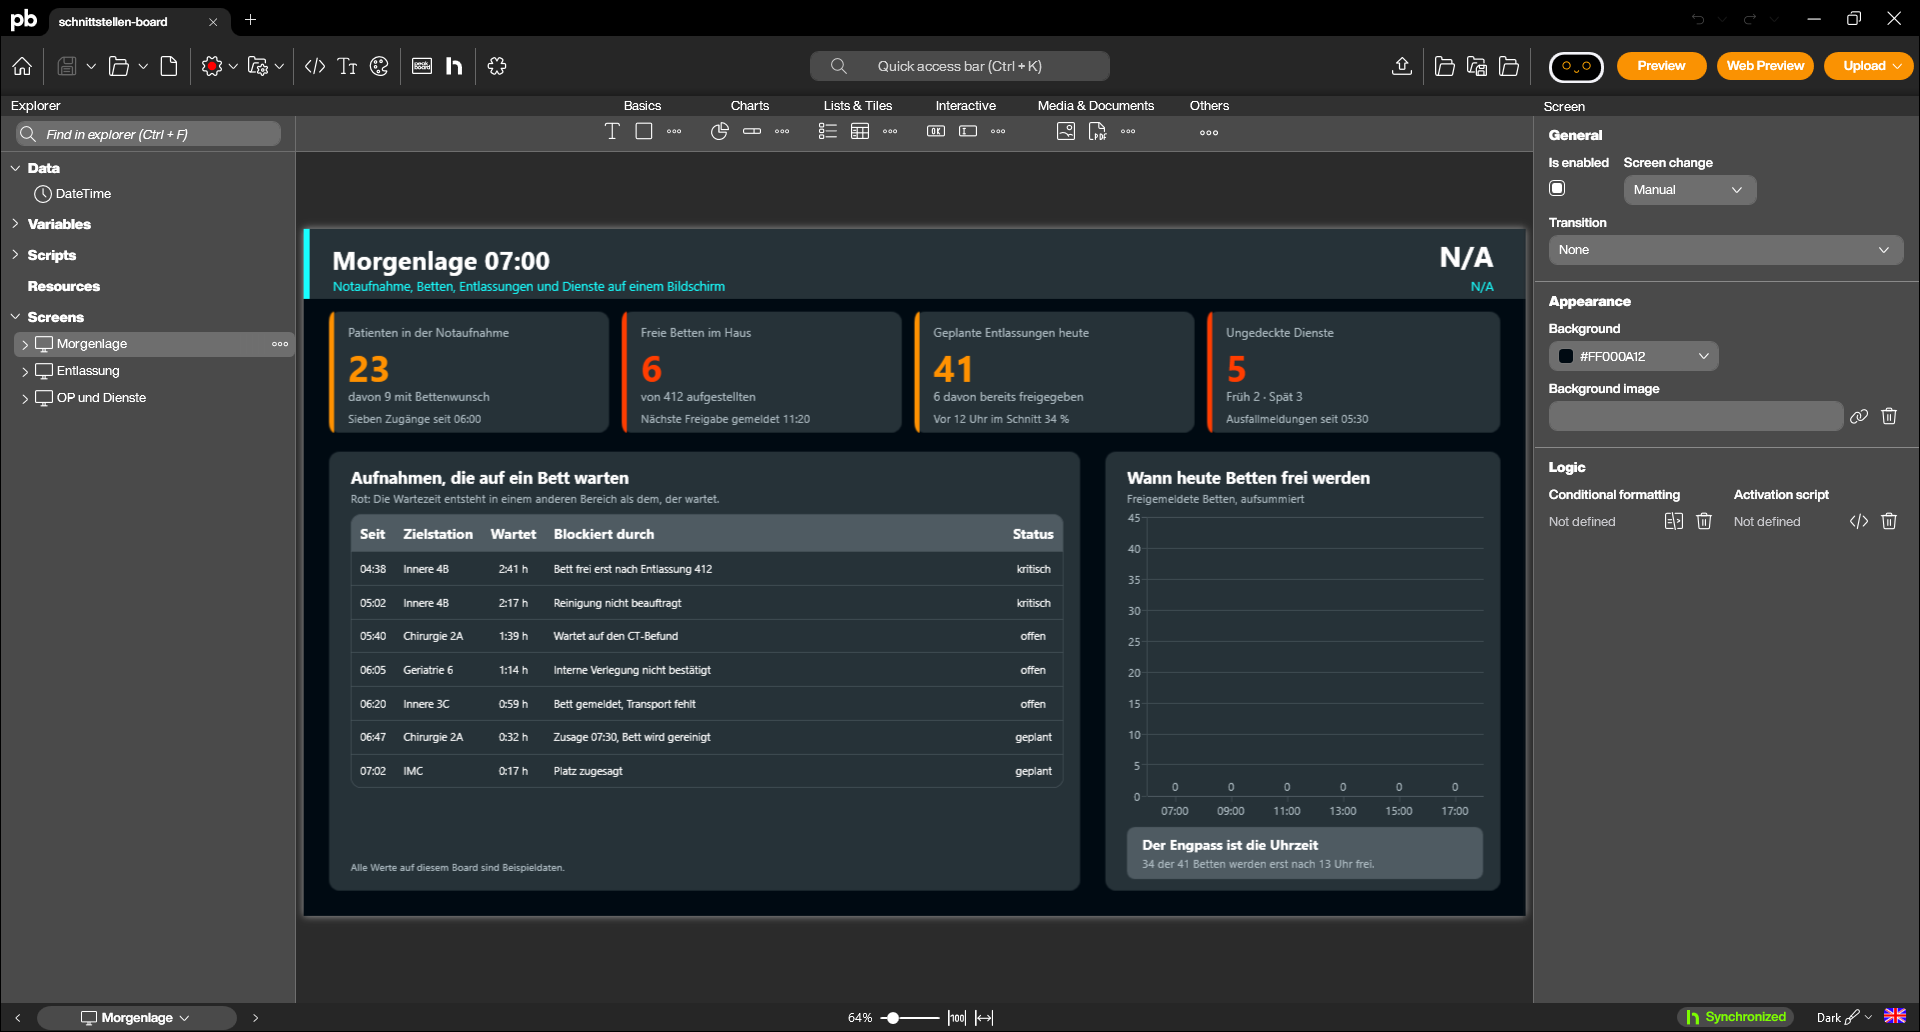
The build uses standard elements: metric tiles, tables with coloured rows and one chart type. Three screens of this kind take an afternoon, once the figures sit in a database, an Excel file or a CSV export.
Trying this out needs no IT project: the Peakboard Designer is free, and the board from this article is available here in the blog. Download schnittstellen-board.pbmx, open it in the Designer and replace the example values with your own.
What a board does not change about silo thinking
It decides no conflicting goals. Where utilisation and patient flow contradict each other, a named rule and a body that sets it are required. The Clinical Operations Framework organises that work without relieving a hospital of it.
It also replaces no agreement on terms. “Free bed” means reported, cleaned or occupiable, depending on the house. A shared screen makes that vagueness visible on all wards at the same time, and the clarification remains a leadership task.
And a board without a routine changes no working day. Without a fixed round that looks at it for five minutes every day and takes decisions, it is decoration on a wall.
What hospitals can take from this
The shortest way out of the method paradox runs through a single interface. A hospital picks the handover with the longest waiting time, makes it visible for every area involved, names the area with the next step in each row, and measures one metric for eight weeks.
After that it can check whether many methods have turned into shared control. Such a hospital can say which decision it took differently because of the effect on another area. How lean, quality management and visual control complement each other is set out in the overview Lean Hospital.
Frequently asked questions about silo thinking in hospitals
What does silo thinking in hospitals mean?
Silo thinking in hospitals describes a way of working in which medicine, nursing, diagnostics and administration each pursue their own goals, metrics and improvement projects. Every area works professionally on its own. Patient waiting time then arises at the handovers between areas, for which no single area carries responsibility.
Why do more management methods not automatically produce better hospitals?
Because most methods work inside one area and leave the handovers between areas untouched. Ralf Volkmer calls this the method paradox in his article of 24 August 2026: quality management, lean hospital work and digitalisation projects run at the same time without a shared management system emerging from them.
Why does the emergency department wait while beds are free in the house?
Because free beds and waiting admissions fall apart in time. The average bed occupancy of German hospitals was 72.0 percent in 2024. Beds mostly become free in the afternoon, while the rush in the emergency department builds up in the morning. The bottleneck therefore sits in the clock and in the reporting chain.
What does a shared board achieve against departmental silos?
A shared board shows the emergency department, beds, discharges, the theatre list and staffing gaps at the same time in one view. It removes no silos, it makes their effect visible: every row names the area that takes the next step, which turns the issue into a shared task of the morning round.
Sources
- Volkmer, Ralf. “Das Methodenparadox der Krankenhäuser: Warum immer mehr Managementinstrumente und Methoden nicht automatisch zu besseren Krankenhäusern führen.” LeanBase, channel LeanHospital, 24 August 2026. https://leanbase.de/publishing/post/2rs32-das-methodenparadox-der-krankenhauser-warum
- Federal Statistical Office (Destatis). “2.0 % more inpatient hospital treatments in 2024.” Press release No. 398 of 6 November 2025. https://www.destatis.de/DE/Presse/Pressemitteilungen/2025/11/PD25_398_231.html
- Volkmer, Ralf. “Krankenhäuser erkennen ihre Schwächen – doch das Vertrauen in die eigene Veränderungsfähigkeit bleibt begrenzt.” LeanBase, 29 August 2026. https://leanbase.de/publishing/post/mvpkg-krankenhauser-erkennen-ihre-schwachen-doch-d